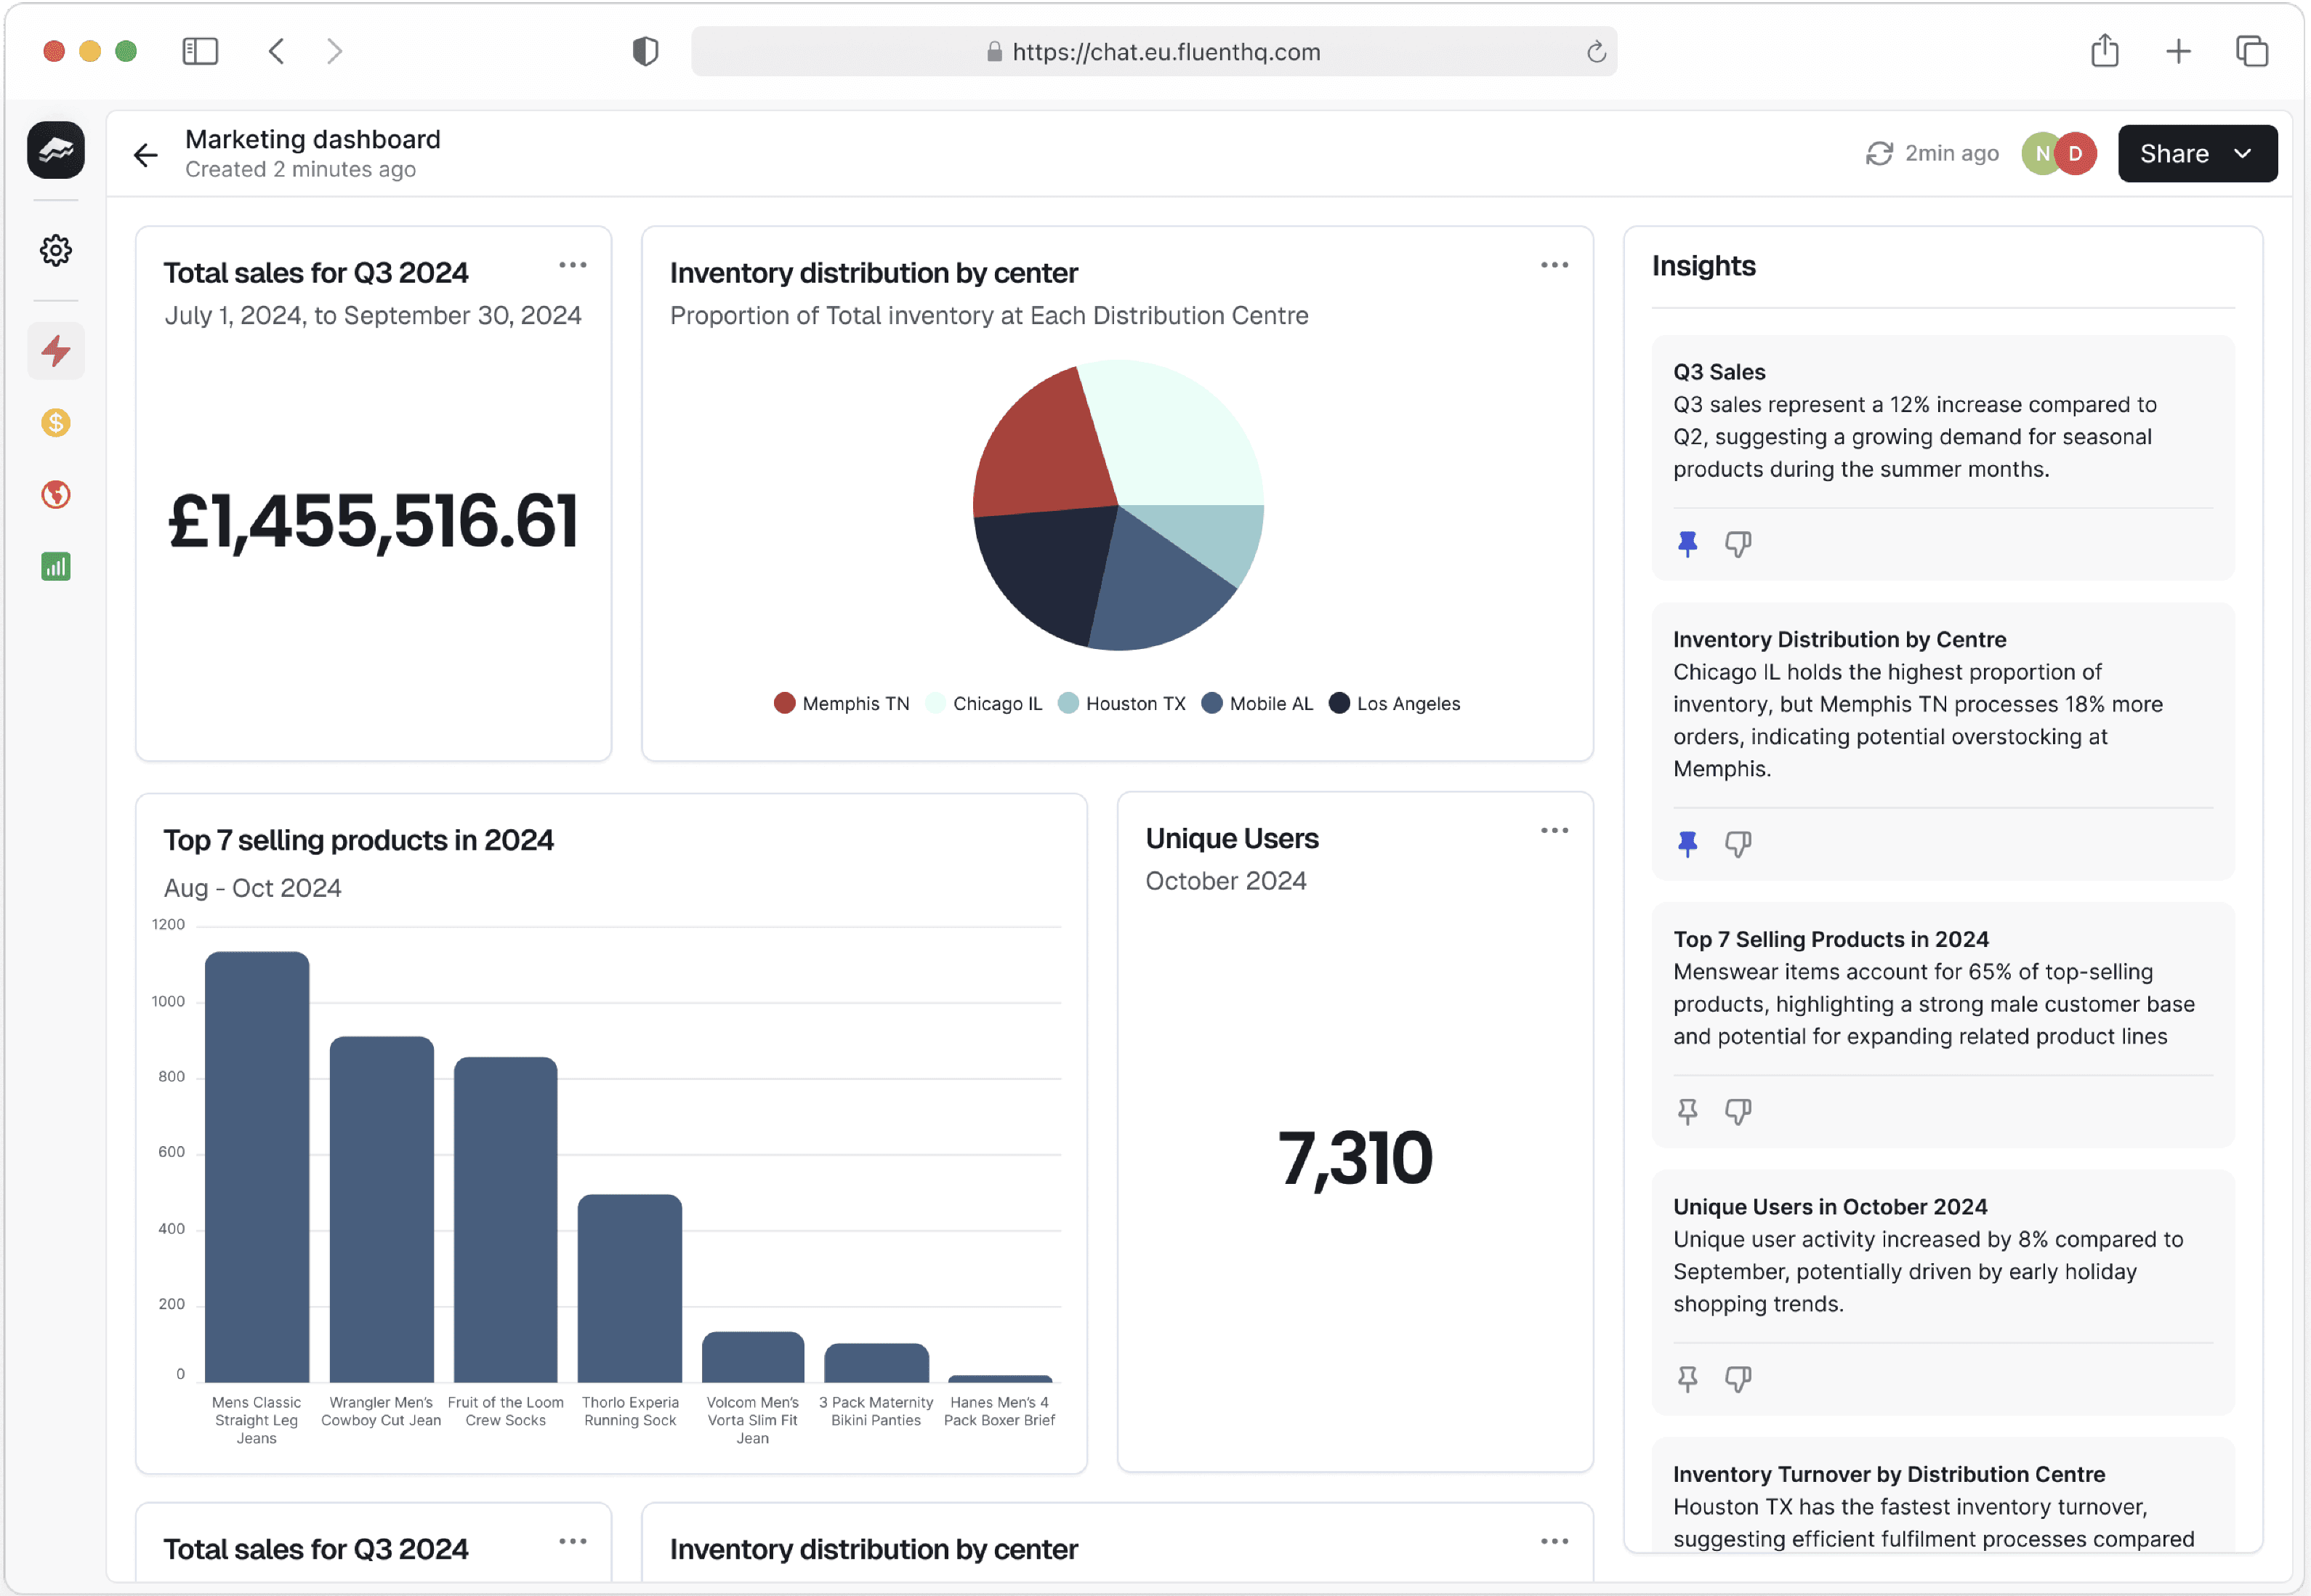
Announcing Fluent Dashboards: Your Data, Visualized
At Fluent, our mission has always been to empower every member of your organization with instant, accurate data insights - no matter their technical background. Today, we’re excited to take that vision one step further. We’re proud to introduce Fluent Dashboards, a new feature designed to transform raw data into clear, compelling visual narratives.
Bringing Your Data to Life
We know that understanding data isn’t just about getting answers - it’s about seeing the story behind the numbers. With Fluent Dashboards, business users can now:
Visualize Key Metrics: Transform ad hoc queries into interactive charts, graphs, and tables that tell your business story at a glance.
Monitor Trends in Real Time: Track performance over time with dynamic visualizations that update as your data changes.
Share Insights Instantly: Easily export and share dashboards with your team, ensuring that every decision is backed by clear, visual data insights.
A Natural Extension of Fluent’s Conversational Interface
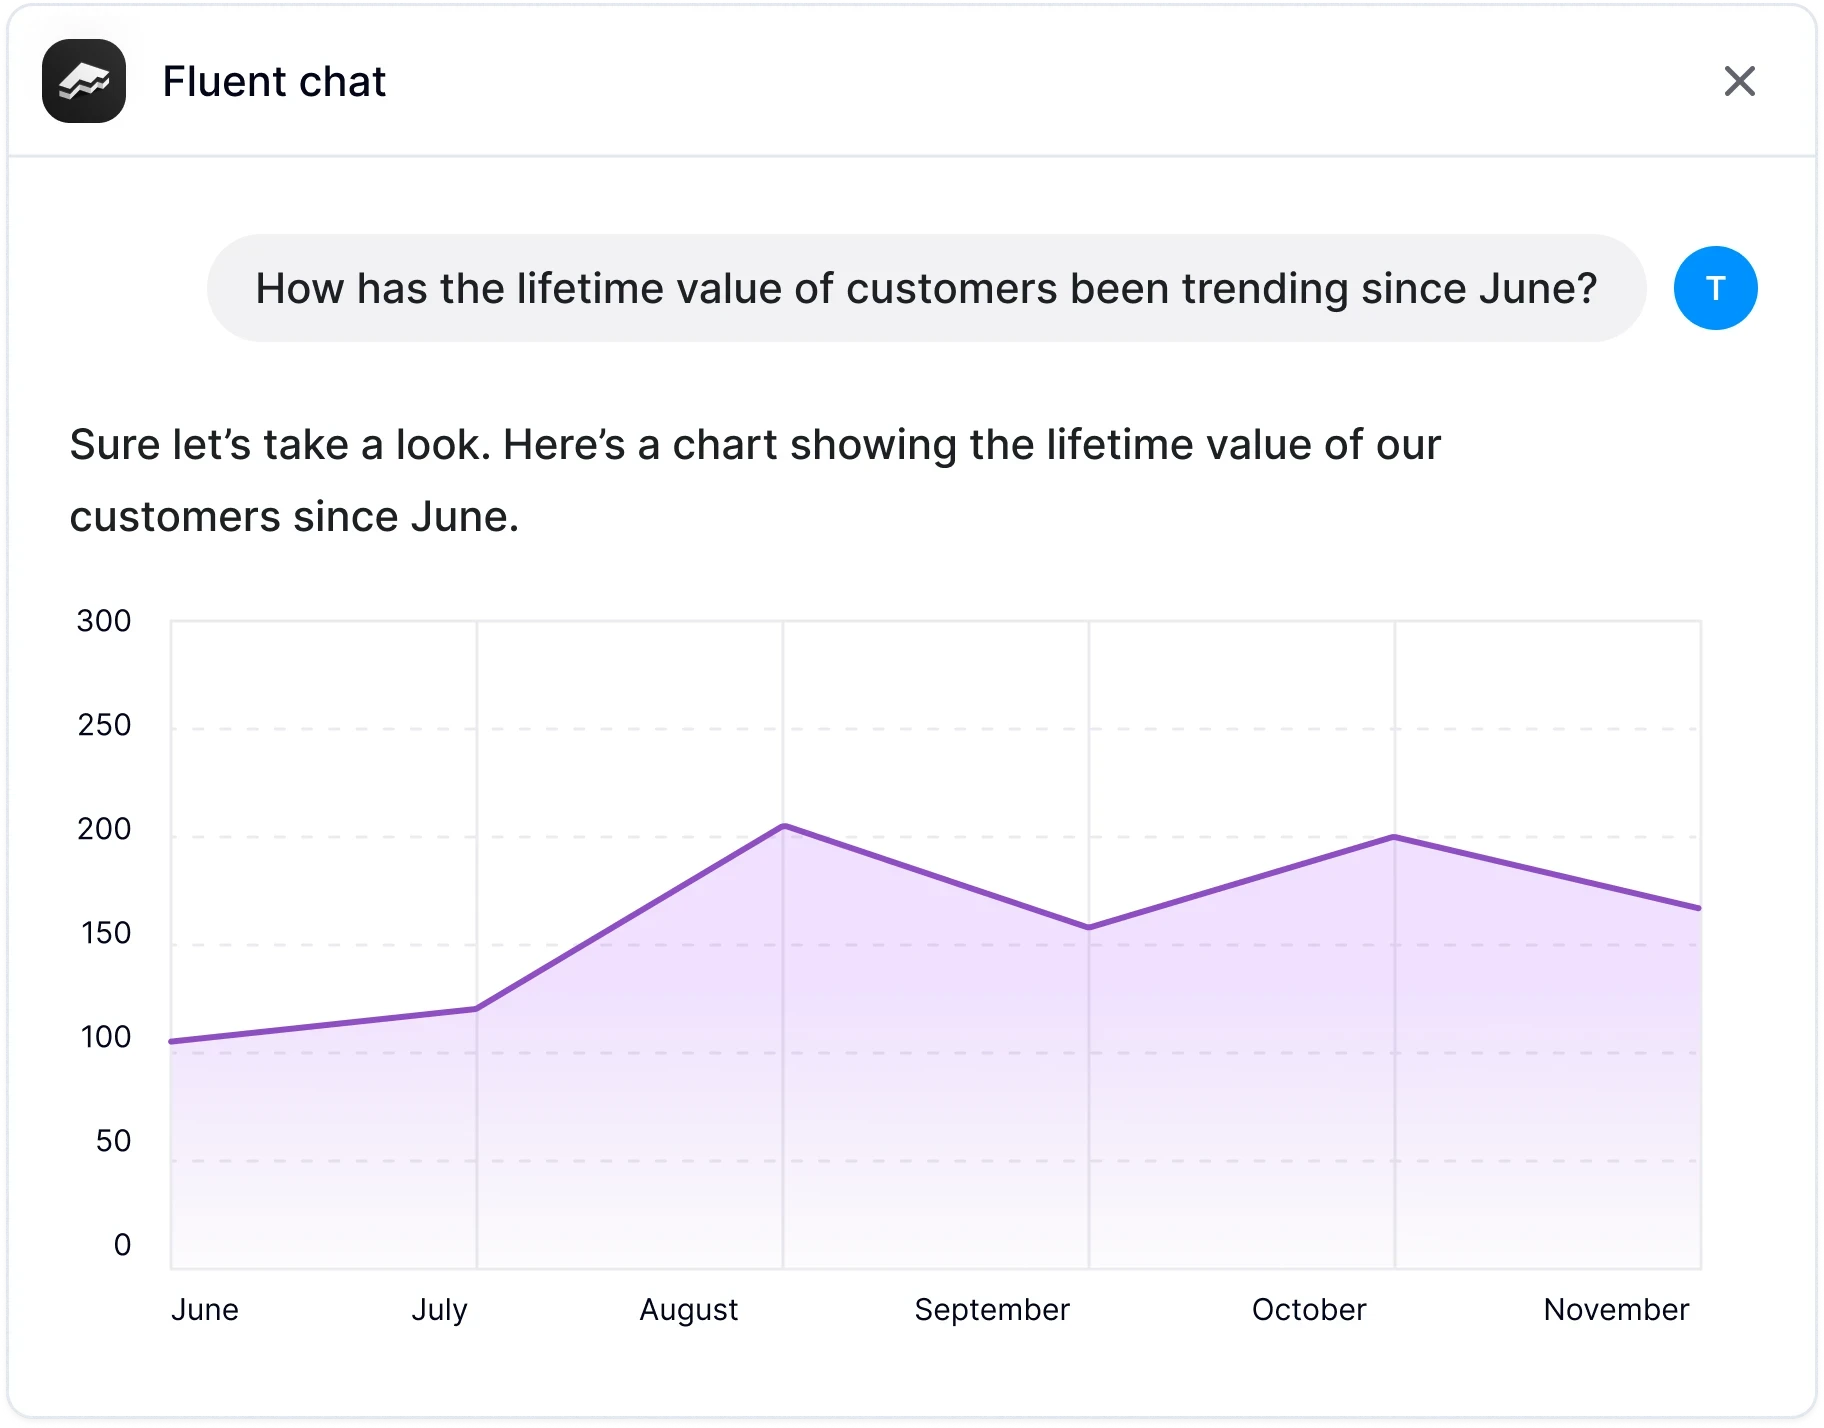
Fluent’s core strength lies in turning natural language queries into actionable insights. With the introduction of dashboards, that power is now complemented by a robust, metrics-first visualization tool. Whether you’re asking, “What were our sales like last quarter?” or “How is customer engagement trending this month?”, Fluent now gives you the option to see these answers as interactive dashboards that update on demand.
How It Works
Ask, and You Shall See: Start with a simple question in plain English. Fluent’s conversational interface processes your query and, if the data is available, offers an interactive visualization as a result.
Customize Your View: Our dashboards are designed with flexibility in mind. Choose the metrics you care about, adjust filters, and rearrange visual components to craft the story that matters most to your business.
Seamless Integration: Fluent Dashboards work in harmony with the rest of the Fluent platform. Whether you’re accessing insights via Slack, Teams, or directly through our web app, your dashboards are always just a few clicks away.
How to create a dashboard from a chat in Fluent:

Why Dashboards Matter
In today’s fast-paced business environment, timely insights are crucial. Dashboards not only make complex data more digestible but also empower teams to make informed decisions—fast. They remove the friction of toggling between multiple tools, bringing clarity and context to every discussion about performance, trends, and opportunities.
Built With You in Mind
Fluent Dashboards were born out of direct feedback from our users. We heard your need for:
Enhanced Visual Storytelling: A way to move beyond numbers and text, and truly see the trends and patterns within your data.
Greater Collaboration: Tools that allow teams to share and build upon insights in real time.
User-Friendly Design: A system that works seamlessly for both data professionals and business users alike.
Our commitment to data governance, accuracy, and user empowerment remains at the core of this launch. With dashboards, you get all the benefits of Fluent’s AI-powered querying, plus the added advantage of interactive, shareable visualizations - all built to scale with your growing business.
Get Started Today
Ready to bring your data to life? Explore Fluent Dashboards now by logging into your Fluent account or booking a demo with our team. We’re eager to show you how this new feature can unlock a whole new level of insight and collaboration for your organization.
Looking Ahead
This launch is just the beginning. We’re continuously working to enhance our platform based on your feedback. In the coming months, expect even more customization options, advanced analytics features, and deeper integrations that make your data work even harder for you.
Thank you for being a part of our journey. With Fluent Dashboards, your data isn’t just queried - it’s visualized, shared, and celebrated.
Let’s put data back into the conversation—together.
Work with Fluent
Put data back into the conversation. Book a demo to see how Fluent can work for you.
10 February 2025
Introducing dashboards
3 February 2025
Fluent Text-to-SQL: Fast, Accurate AI Data Querying
Stay up to date with the Fluent Newsflash
Everything you need to know from the world of AI, BI and Fluent. Hand-delivered (digitally) twice a month.
