Jun 17, 2025
Where the Time Goes: The Hidden Cost of Marketing Reporting
Reporting has always been one of the most important things agencies do. It’s how you translate work into value. It’s how clients see results. And it’s how strategic thinking...

Reporting has always been one of the most important things agencies do.
It’s how you translate work into value. It’s how clients see results. And it’s how strategic thinking gets communicated.
But it’s also one of the most expensive, manual, and operationally fragile processes inside most agencies.
Over the last six months, we spoke with 104 marketing agencies and analysed thousands of hours of reporting workflows. This included a mix of interviews, workflow audits, time-tracking data, and process breakdowns across agencies of different sizes and specialisms.
Our goal was to answer three key questions:
Where does the time actually go?
Who’s involved - and at what cost?
What can be done to improve it?
What Reporting Actually Involves
Most reporting workflows follow a similar path:
Raw Data → Dashboards → Analysis → Commentary → Output
Each stage brings handoffs, tools, and opportunities for delay or inconsistency:
Raw Data: Typically extracted manually from platform UIs like Meta, GA4, CRMs, or media buying tools.
Dashboards: Often exist in Looker Studio, spreadsheets, or bespoke tools - but vary widely by client or team.
Analysis: Usually happens across Slack threads, Notion pages, or someone’s head.
Commentary: Written by Account Managers or Strategists, often last-minute and under pressure.
Output: Delivered in decks, Notion pages, emails, or PDFs – with significant formatting effort each time.
In 78% of agencies, at least three different people touch each client report before it goes out.
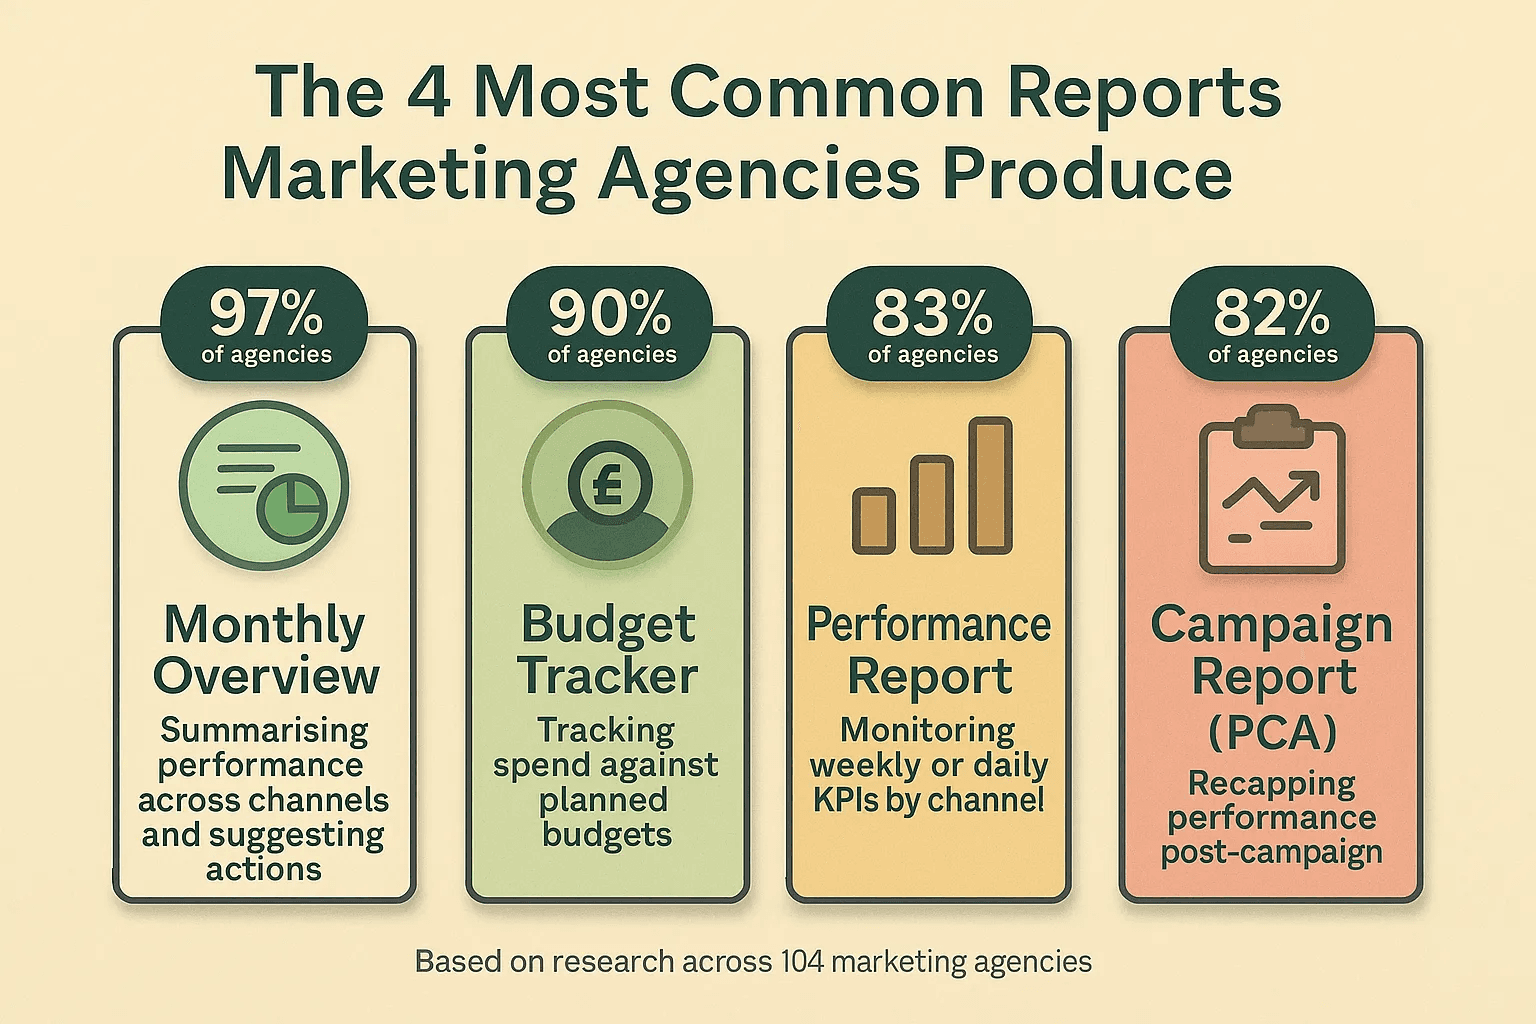
Report Types by Frequency and Format
Marketing agencies produce a wide range of reports - some designed for client delivery, others used internally to stay on track. This breakdown includes both client-facing outputs and internal reporting practices such as pacing checks, Slack-based updates, and mid-week summaries that keep teams aligned.
Report Types by Cadence, Use Case, and Format
Report Type | Cadence | Purpose / Use Case | Owner (Reviewer) | Format | % Doing This | Comment |
|---|---|---|---|---|---|---|
Weekly Check-Ins / Pulse Updates | Typically Weekly | Keeping clients informed with highlights, anomalies, risks | Account Manager (Exec) | Slack, Email, Notion | 44% | Often done informally; few standardise it. More common on high-touch retainers. |
Performance Reports (Channel-Level) | Daily or as needed | Identifying campaign issues and delivery gaps in real-time | Analyst (Exec/AM) | Slack, Email, Dashboard | 83% | One of the most common report types; usually pulled from ad platforms or dashboards. |
Budget Pacing Reports | Weekly or Monthly | Monitoring spend vs. plan and flag over/underspend | Ops Lead (Account Manager) | Spreadsheet, Dashboard, PDF, Slide deck | 90% | Critical for paid media accountability; almost always tracked. |
A/B Test Reports | Test-end / Ad hoc | Communicating experiment outcomes and optimisation learnings | Analyst (Performance Lead) | Notion, PDF, Email | 28% | Low formalisation. Often captured in Slack or decks, but not consistently reported. |
Campaign Reports (PCA) | End of Campaign | Evaluating results, extracting insights, demonstrating ROI | Analyst (Strategist) | Deck, PDF, Notion | 82% | High-value report, usually expected by clients post-campaign. |
Monthly/Quarterly Overview Reports | Monthly / Quarterly | Holistic view across channels to client stakeholders | Account Manager (Strategist) | Slide deck, PDF | 97% | The most standardised report type; central to client communication. |
Forecasting & Planning Reports | Monthly / Quarterly | Model future outcomes, guide budget or strategy planning | Strategy Lead (Director) | Spreadsheet, Deck, PDF | 73% | Done by mature or strategic teams; tied to planning or exec asks. |
Competitive Benchmark Reports | Monthly / Quarterly | Compare client performance to market or competitor benchmarks | Strategist or Account Manager | Slide deck, PDF | 26% | Seen as a high-value add but only done by a small % of agencies. |
Note: Only report types used by more than 20% of agencies are included, based on Fluent’s research across marketing agency teams.
This breakdown reveals two important truths about reporting in agencies:
Standard ≠ Strategic: Reports like performance updates, pacing checks, and monthly overviews are nearly universal - but they rarely differentiate one agency from another. They’re expected. Efficient. Necessary.
Opportunity Lives in the Gaps: The least common reports - forecasting, strategic summaries, and competitive benchmarking - are where agencies can demonstrate insight, leadership, and long-term thinking. These are harder to produce, but disproportionately valued by senior stakeholders.
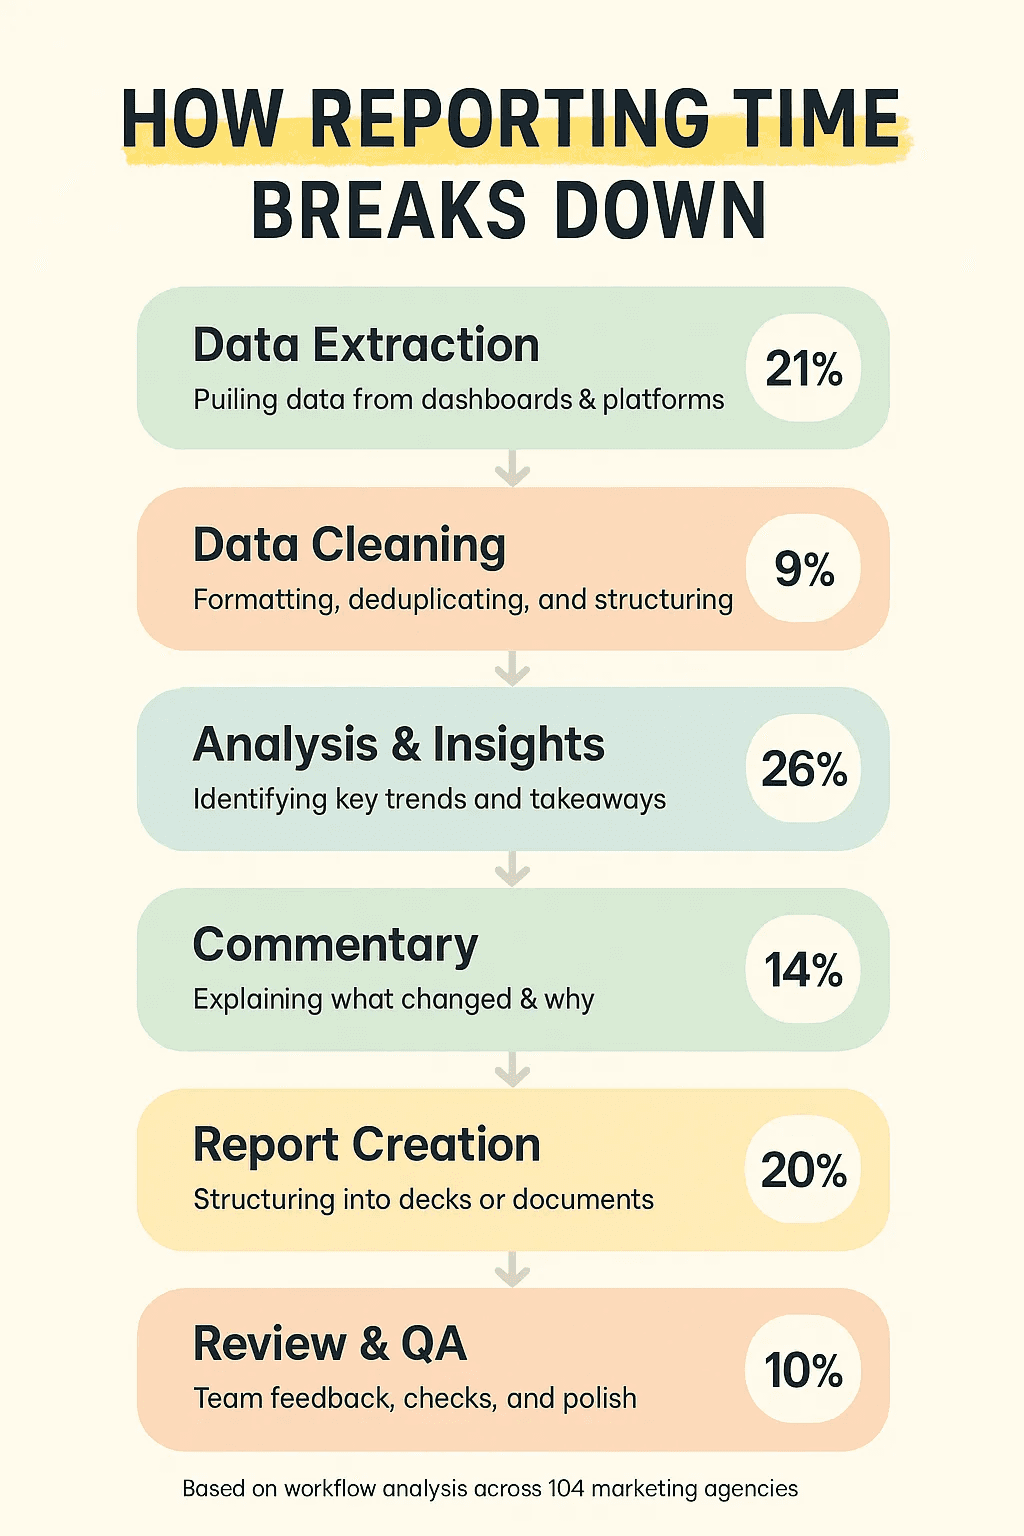
How Reporting Time Breaks Down
Based on analysis across 104 marketing agencies, we mapped how internal reporting time is actually spent - from pulling the data to final sign-off. These percentages reflect averages across team sizes, structures, and verticals.
Stage | What It Involves | Average % of Time |
|---|---|---|
Data Extraction | Pulling data from dashboards, ad platforms, CRMs, analytics tools | 21% |
Data Cleaning | Formatting, deduping, checking consistency | 9% |
Analysis & Insights | Identifying key trends, anomalies, and opportunities | 26% |
Commentary | Explaining what changed and why it matters | 14% |
Report Creation | Structuring into decks, docs, or PDFs | 20% |
Review & QA | Team feedback, accuracy checks, polishing language | 10% |
Note: This excludes time spent on client delivery (sending, presenting, walking through reports) and follow-up questions - both of which add hidden overhead that often goes untracked.
While every agency’s workflow differs slightly, a few clear patterns emerged:
Only 1 in 3 minutes goes toward actual insight generation. The rest is prep, packaging or rework.
Report Creation takes as long as Data Extraction - and both are usually manual.
Commentary is the first thing squeezed under pressure - but it’s what clients remember most.
Review & QA is often seen as a formality - yet still takes 10%, mostly fixing avoidable issues.

And that’s just the internal cost. When you zoom out across agency sizes, the total effort is even more revealing…
Time Per Report by Agency Size
We broke down the average monthly time agencies spend on reporting per client, based on report frequency and internal workflow time:
Agency Size | Average Reports / Client / Month | Average Time / Month / Client |
|---|---|---|
Small (Up to 50) | 2.3 | 20–30 hours |
Medium (51–250) | 4.3 | 25–35 hours |
Large (251+) | 4.3 | 40–60 hours |
Figures include time spent across data extraction, analysis, commentary, formatting, review, and internal sign-off. Monthly averages were calculated by taking each agency’s reported number of reports per client per year and apportioning it evenly across months.
Reporting load isn’t just about how big your agency is - it’s shaped by the type of clients you work with.
In general, we found that larger agencies tend to serve larger, more complex clients (no surprises there!). These clients want deeper insight, more frequent reporting, and higher polish - often across multiple stakeholders or departments.
That said, most agencies have a few smaller clients who expect weekly decks, daily updates, and quarterly strategy documents - all on a modest spend. The output isn’t always proportional to the value of the account.
So while there’s a clear correlation between agency size and overall reporting time, the real driver is the number and complexity of reports each client requires and the shape of the internal workflow that supports them.
When you combine volume with how time is actually spent, a few truths emerge:
Even at 20–30 hours per client per month, over 10 of those hours typically go to commentary and formatting
At the top end, 60+ hours per client per month is common - and nearly half that effort is on work that’s repetitive, fragile, and hard to delegate
The numbers here reflect the averages we observed across 104 agency teams - but the operational load varies massively from client to client depending on how reporting is structured.
The Real Cost of Reporting - Per Client, Per Month
Reporting might look like a small line item - but once you account for who’s involved and how much time they spend, the true cost quickly stacks up.
Below, we’ve broken it down by role, time, and fully-loaded cost - giving a clear view of what reporting really costs, per client, per month.
While the time adds up fast, the real cost of reporting lies in how many people are involved - and how much of their effort is diverted from higher-value work.
This breakdown shows what it typically costs to produce reporting for a single client, based on:
A 25-hour monthly workload (a conservative estimate from above)
Inputs from performance analysts, client managers, and strategists
Fully-loaded costs that reflect the real cost to the business - not just base salaries
Cost Per Client Report – by Function
Function | % of Report | Time Spent (hrs) | UK Cost (avg) | US Cost (avg) |
|---|---|---|---|---|
Analyst | 60% | 15.0 | £210.60 | $357.60 |
Client Management | 20% | 5.0 | £87.50 | $135.50 |
Strategy | 20% | 5.0 | £145.20 | $263.00 |
Total | 100% | 25.0 | £443.30 | $756.10 |
Salary Benchmarks Used - Cost to Business
Function | Role Title | Base Salary | Cost to Business – Annual | Cost to Business – Hourly |
|---|---|---|---|---|
Analyst | Performance Analyst | £35,000 / $62,000 | £45,500 / $80,600 | £14.04 / $23.84 |
Client Management | Account Manager | £42,000 / $68,000 | £54,600 / $87,400 | £17.50 / $27.10 |
Strategy | Strategy Lead | £48,000 / $85,000 | £61,200 / $110,500 | £29.04 / $52.60 |
Salary benchmarks drawn from Glassdoor, Payscale, and Salary.com, cross-referenced with Fluent’s internal research across 104 agencies. “Cost to Business” includes overheads, payroll taxes, pension contributions, software, and equipment - representing the true cost of each employee to the agency.
What That Looks Like at Scale
Multiply these per-client costs out and you start to see how big a line item reporting really is:
Clients | UK Monthly Cost | US Monthly Cost | UK Annual Cost | US Annual Cost |
|---|---|---|---|---|
20 | £8,866 | $15,122 | £106,392 | $181,464 |
100 | £44,330 | $75,610 | £531,960 | $907,320 |
500 | £221,650 | $378,050 | £2.66M | $4.54M |
Even for a mid-sized agency with 20–30 active clients, reporting alone can easily exceed £100k/year in hidden costs.
Why It Matters
Most of this time isn’t spent on deep strategic insight - it’s spent extracting data, formatting outputs, and manually writing up commentary that’s often duplicated or rushed.
The workload cuts across three high-value roles, pulling them away from growth-driving activity: strategy, creative, or performance improvement.
Agencies rarely track this as a standalone cost - but when they do, it almost always ranks in the top 3 sources of hidden margin erosion.
The Hidden Operational Load
The true cost of reporting isn’t just time - it’s the operational drag it creates across your agency.
It affects:
Margin: high-value team members get stuck formatting slides or rewriting commentary instead of driving growth.
Consistency: without standardisation, reports vary in quality, style, and insight - and clients notice.
Delivery risk: if one person holds the process, things stall when they’re off sick or leave the team.
Onboarding speed: new hires take months to learn what “good” looks like for each client because it’s never written down.
Morale: reporting often gets done last minute, late at night, or squeezed between other priorities - which wears teams down.
Insight quality: rushed formatting eats into time for analysis and strategy, so recommendations get watered down.
These hidden loads rarely show up on a balance sheet - but when you fix them, the impact is immediate: faster onboarding, sharper output, and more headspace for the work that actually moves the needle.

How Agencies Are Driving Efficiency
A growing number of agencies are making small changes that lead to big time savings. Here are some of the most effective tactics we’ve seen:
Template standardisation: Create standard report templates across clients – not just in format, but also in narrative structure and recurring sections.
Modular commentary libraries: Maintain internal libraries of reusable commentary and KPI descriptions, so teams don’t rewrite the same insights repeatedly.
Audit reporting hours like bilables: Track time spent per report or client - even loosely - to benchmark and identify outliers or heavy-lift accounts.
Automate the hand-offs, not the whole report: Agencies who save the most time often automate repeatable parts (data pulls, formatting) while keeping final review and insight crafting human.
Rethinking the Reporting Balance
Every agency knows reporting is important. But few are actively reshaping how it gets done.
What this data shows isn’t that reporting is broken - it’s that too much of the effort goes into tasks that add the least value:
Copying numbers between dashboards and decks
Formatting slides to match different client styles
Rewriting commentary that already exists elsewhere
Meanwhile, the work that actually builds trust - identifying trends, interpreting impact, and guiding decisions - often gets squeezed for time.
The opportunity isn’t to cut back on reporting. It’s to rebalance it.
Shift the effort toward insight, and away from assembly.
Agencies that do this don’t just save time. They deliver better reports, make faster decisions, and free up teams to focus on what really moves the needle.
UPLOAD YOUR CLIENT REPORT AND SEE HOW FLUENT CAN AUTOMATE YOUR PROCESS


