Jun 16, 2025
The Modern Marketing Agency Data Stack: Where Fluent Fits
Most agencies aren’t looking to reinvent their stack - they just want to improve how it runs. Especially when it comes to client reporting. This guide is designed to help marke...

Most agencies aren’t looking to reinvent their stack - they just want to improve how it runs. Especially when it comes to client reporting.
This guide is designed to help marketing agency leaders, client services teams, and analysts understand where Fluent fits within their current setup, what role it plays, and how it removes one of the biggest bottlenecks: turning data into client-ready narratives.
We cover:
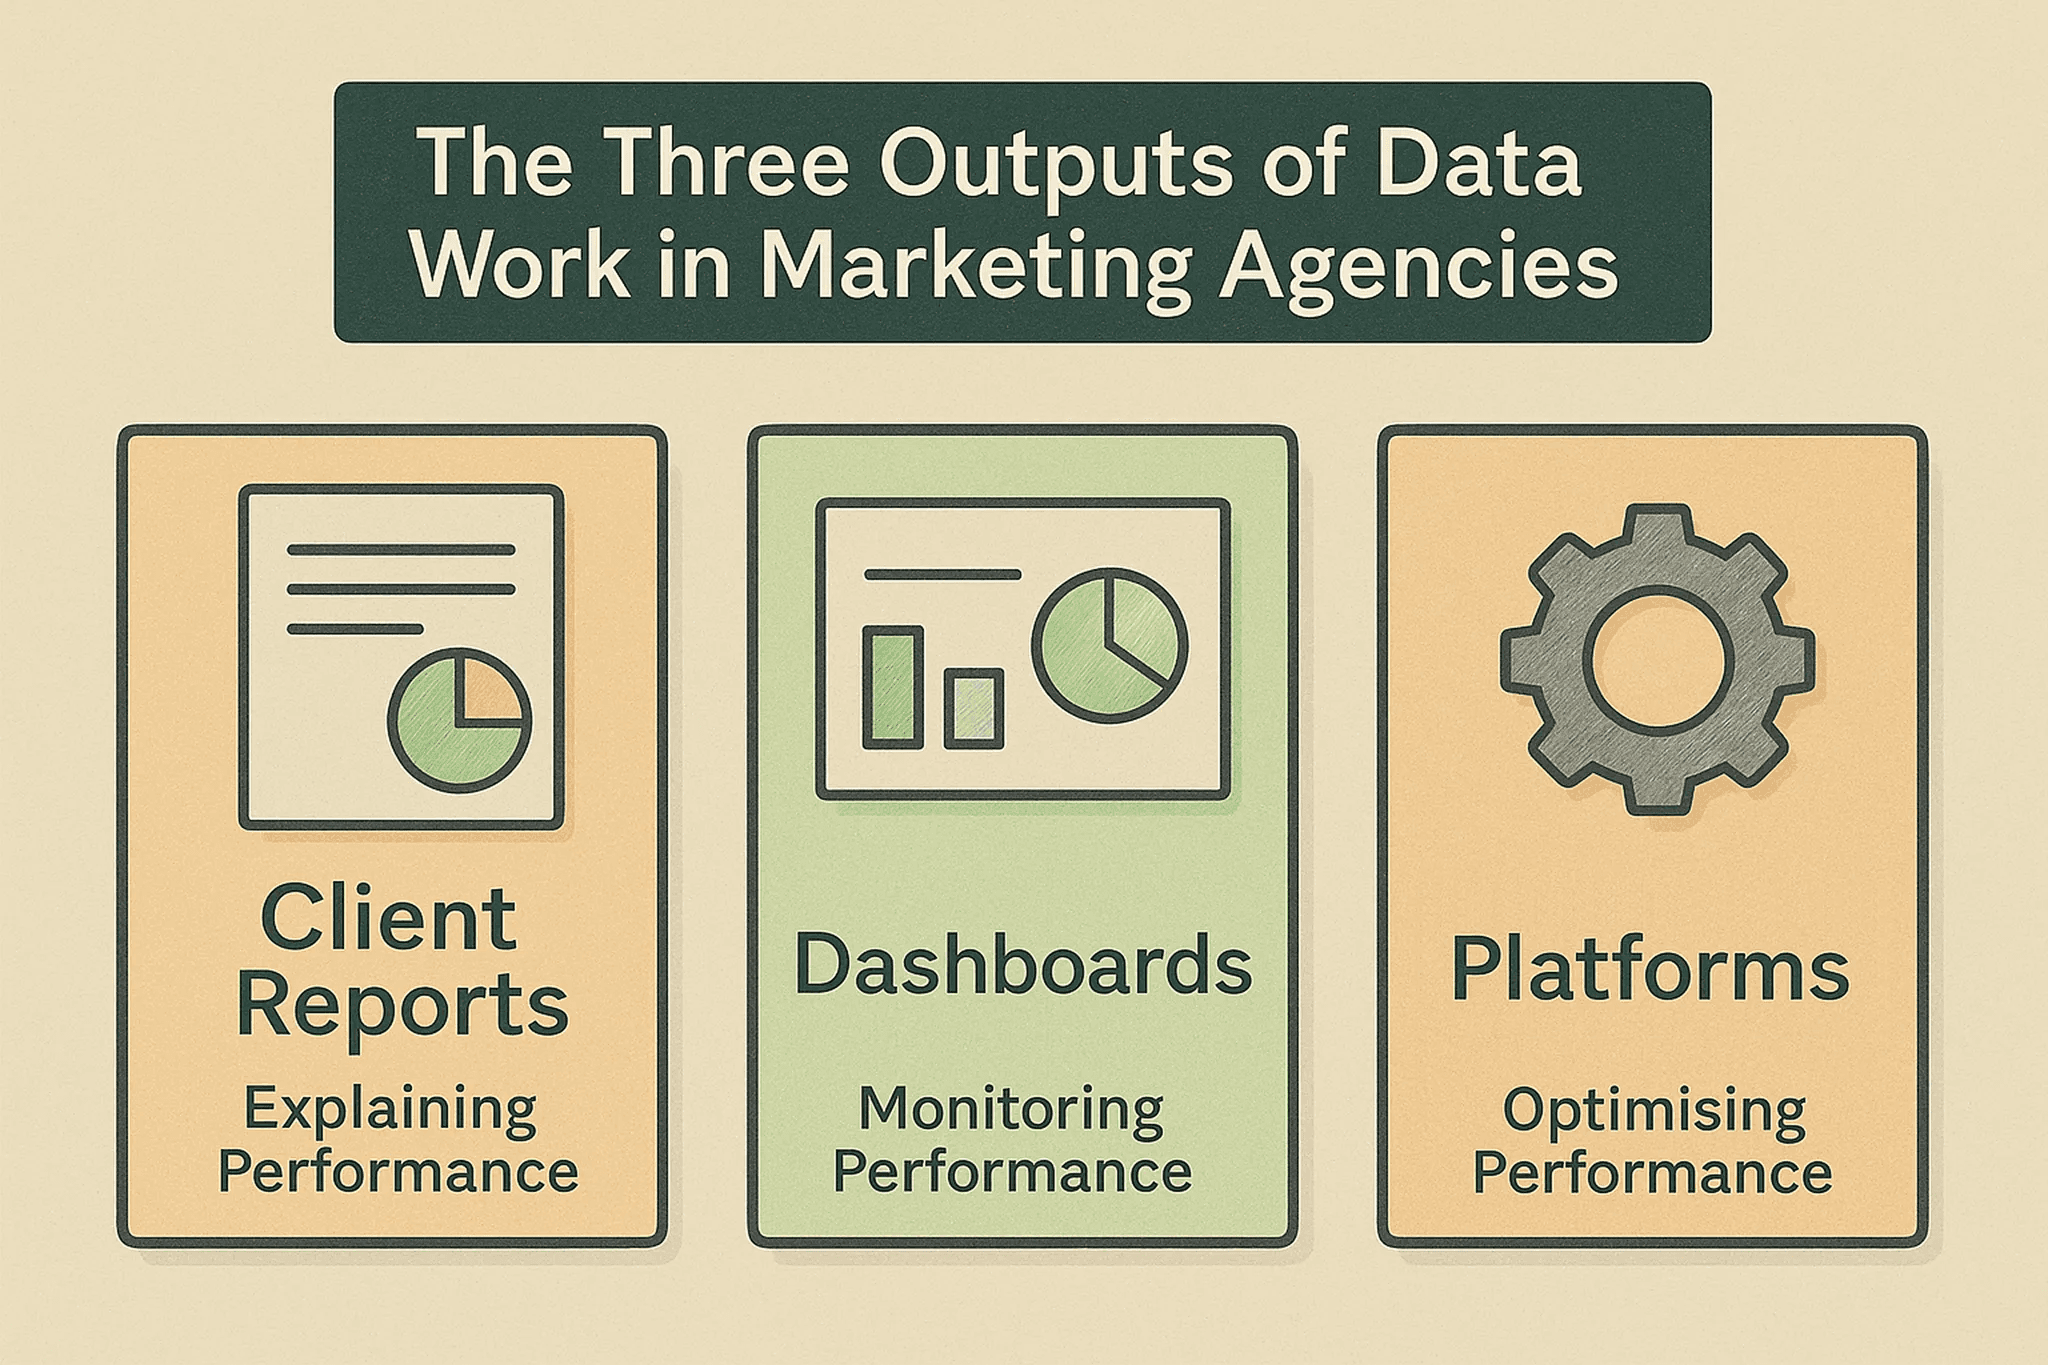
The three core outputs agencies produce from data
Where Fluent fits in your existing stack
How workflows vary across agency sizes
Why client reporting remains the most manual, time-intensive part – and how to fix it
The Three Ways Agencies Use Data
Agencies rely on data in three core ways - each with its own function, cadence, and audience:
Use Case | Relationship to Performance | Tool Examples | Output |
|---|---|---|---|
Client Reporting | Explains performance - what happened, why, and what it means | Fluent, Slides, Emails | QBRs, decks, summaries |
Dashboards | Tracks performance - what’s happening right now | Looker, Tableau, AgencyAnalytics | Live dashboards, scorecards |
Platform Optimisation | Changes performance - tweaks to drive better outcomes | Meta Ads, Google Ads, TikTok Ads | Bids, budgets, audiences |
While all three are essential, they come with different expectations, time pressures, and strategic weight.
Platform optimisation happens fast and frequently - it’s about real-time tweaks and experiments to improve results.
Dashboards give internal teams visibility and alignment - tracking performance as it unfolds.
Client reporting is slower but more strategic - turning performance into clear, client-ready stories. It’s where your work is scrutinised, and your value is made visible… And yet, it’s also the most manually produced.
Platforms run campaigns. Dashboards monitor them. But reporting is where your value is showcased.
It’s also where time gets lost. Fluent automates that last mile — turning tracked performance into ready-to-send reports.
The Marketing Agency Data Stack – End to End
Most marketing agencies now use a layered data stack to collect, unify, and activate their performance data. But while tools have matured for pulling in data and visualising metrics, generating client-ready reporting still involves manual work.
Here’s a breakdown of the full marketing agency data stack - from raw data collection to final outputs - and who typically owns each part of the process:
Layer | Purpose | Example Tools | Who Uses It |
|---|---|---|---|
Platforms | Source of truth for campaign performance | Meta Ads, Google Ads, TikTok Ads, GA4 | Performance, Client Services |
Connectors | Extract and sync data from platforms | Funnel.io, Fivetran | Data/Analytics |
Warehousing | Centralise and store unified data | BigQuery, Snowflake | Data teams at larger agencies |
Modelling | Clean, transform, and structure data for analysis | dbt, SQL | Data teams |
Dashboards & BI | Surface key metrics - not insights | Looker, Tableau, AgencyAnalytics | Analysts, CS, Performance |
Client Reporting | Turn data into insight and client-ready narrative | Slides, Notion, Email – and Fluent | Strategy, CS, Performance Leads |
While every layer in the stack plays a distinct role, they differ in visibility, ownership, and strategic weight.
Platforms and connectors are the technical plumbing - essential for data flow, but largely invisible to most of the team.
Warehousing and modelling introduce structure and scale, but tend to be the domain of larger agencies.
Dashboards give broad visibility and help teams monitor live performance - they’re shared across roles, but often limited to showing what is happening.
Client reporting is where interpretation happens. It’s the only layer designed for external communication - where teams explain why results look the way they do, and what to do next.
Despite being the most visible output to clients, this final layer is also the least standardised and the most reliant on manual effort. It sits at the intersection of performance data, business context, and brand storytelling - making it both critical and complex.
In many agencies, this is where the stack hands off from automation to human judgement - and where bottlenecks begin to appear.
Stack by Agency Size
As agencies grow, their data stacks typically become more structured. Smaller teams often prioritise speed and simplicity, using lightweight tools to stay agile. Larger teams invest in infrastructure like data warehouses and modelling layers to manage scale and complexity.
This evolution doesn’t follow a single path, but common patterns do emerge - especially in how teams organise data, surface metrics, and produce outputs for internal and client use.
Agency Size | Typical Stack | Notes |
|---|---|---|
Small (1–20 people) | Platforms → Funnel.io → Google Sheets → Dashboards → Manual reports | No warehouse or dbt. Reporting fully manual – usually done by CS or performance leads. |
Mid-size (20–100) | Platforms → Supermetrics/Fivetran → GA4 or BigQuery → Looker → Manual slides | Light modelling layer. Reporting effort grows significantly as client base scales. |
Large (100+) | Platforms → Fivetran → Snowflake → dbt → Dashboards → Analysts write reports | Full data stack. Reporting is still largely manual – often 10–20 hours/client/month. |
Data maturity scales with headcount: warehousing and modelling tend to appear first in mid-sized agencies, often led by a dedicated analytics function.
Tooling doesn’t eliminate manual work: even with dashboards and structured data, many reporting tasks (summarising performance, writing insights) remain person-led.
Ownership shifts over time: in smaller teams, reporting is often part of a broader client-facing role. In larger teams, it becomes more centralised within data or strategy functions.
This progression isn’t universal, but it reflects a common pattern: as tech stacks mature, so do the workflows built around them - though reporting tends to retain a mix of tools, templates, and team-driven processes.
Automating the Final Step in Charlie Oscar’s Data Stack
Charlie Oscar is a UK-based digital marketing agency with a 50-person team, helping consumer brands scale through performance marketing, paid media, and digital strategy.
Their data stack was already well-established - data from all major ad platforms flowed into BigQuery, was modelled for consistency, and visualised across multiple dashboard tools. But despite this, reporting workflows remained manual. Account managers and paid specialists were spending significant time assembling daily, weekly, and monthly reports by hand.
With Fluent, Charlie Oscar has been able to fully automate this final step:
Fluent connects to their existing stack - including BigQuery, GA4, and Meta.
Paid media leads and account managers generate reports with a single click.
Outputs follow Charlie Oscar’s templates, tone, and formatting - ready to review or send.
What previously took days now takes minutes - freeing teams to focus on insight and strategy rather than formatting.
Their experience highlights an important shift: even in agencies with mature data operations, AI is opening up new opportunities to rethink workflows - particularly in areas that have long resisted automation.
👉 Read the full Charlie Oscar case study
Where Fluent Fits - Completing the Stack
While most data stacks today handle collection, storage, and visualisation efficiently, one part of the workflow remains surprisingly hands-on: client reporting.
This stage typically involves interpreting campaign results, identifying key trends, and turning them into client-facing narratives. It’s an essential output - but also one that often sits outside the structured, automated flow of the rest of the stack.
We’ve seen that even in well-established teams, this step is still handled manually by account leads, strategists, or analysts - using a mix of dashboards, slides, screenshots, and commentary.
Fluent helps streamline this final stage by:
Connecting to existing data sources (e.g. BigQuery, GA4, Meta)
Converting structured data into summaries, recommendations, and reports
Maintaining consistency across outputs while freeing teams to focus on insight, not formatting

In mid-sized agencies, reporting can take anywhere from 15–30 hours per client per month. That effort adds up quickly - especially across multiple reporting cadences and stakeholders.
For example: reporting for five clients at 15 hours/month each = 337.5 hours/month — roughly 2 FTE of effort reclaimed.
👉 Calculate how much reporting is currently costing your agency
Closing Summary
The modern marketing agency data stack gives teams powerful ways to collect and visualise data. But explaining what happened, why it happened, and what to do next still takes hours of manual effort.
This guide lays out the full picture - so your team can see where tools help, where gaps remain, and how Fluent supports the final step in delivering value to clients.


