Blog
Adopting AI
How to train your LLM for peak performance
Empower business users with self-serve analytics. Learn how a metrics layer enables LLMs to deliver precise, contextual BI insights—no SQL required.

Liam Garrison
Tech Lead
Oct 14, 2024
Imagine this scenario: you're a Junior Analyst in your first week at a new job. Your messenger pings. It's the Head of Sales asking, "Can you tell me how revenue is trending in the Southwest region, month on month?"
Ad-hoc queries like this come in countless forms. They’re important pieces of insight, but force analysts to constantly context-switch. Using LLMs and AI as part of a BI strategy - specifically in reducing the workload of answering ad-hoc questions - is increasingly attractive. However, LLMs aren’t infallible. When they encounter ‘trust issues’, it can stem from little more than one unsatisfactory interaction with a senior stakeholder.
Business users don't trust LLMs that:
Generate inaccurate or incomplete answers
Frequently hallucinate
Can’t explain themselves; the ‘black-box' perception
Struggle with edge case questions
Can’t flag when they don’t know an answer, and resort to guessing.
Some technical teething troubles are expected with any new AI tool (just as they would be with a newly-hired analyst).
However, not all errors are the fault of the LLM itself, they can often be mitigated through the way the model is trained on relational data.
Starting From Day One
You wouldn’t expect a new hire to instantly know every nuance of a business on their first day. It takes training to build context and familiarity. The same principle applies to an LLM.
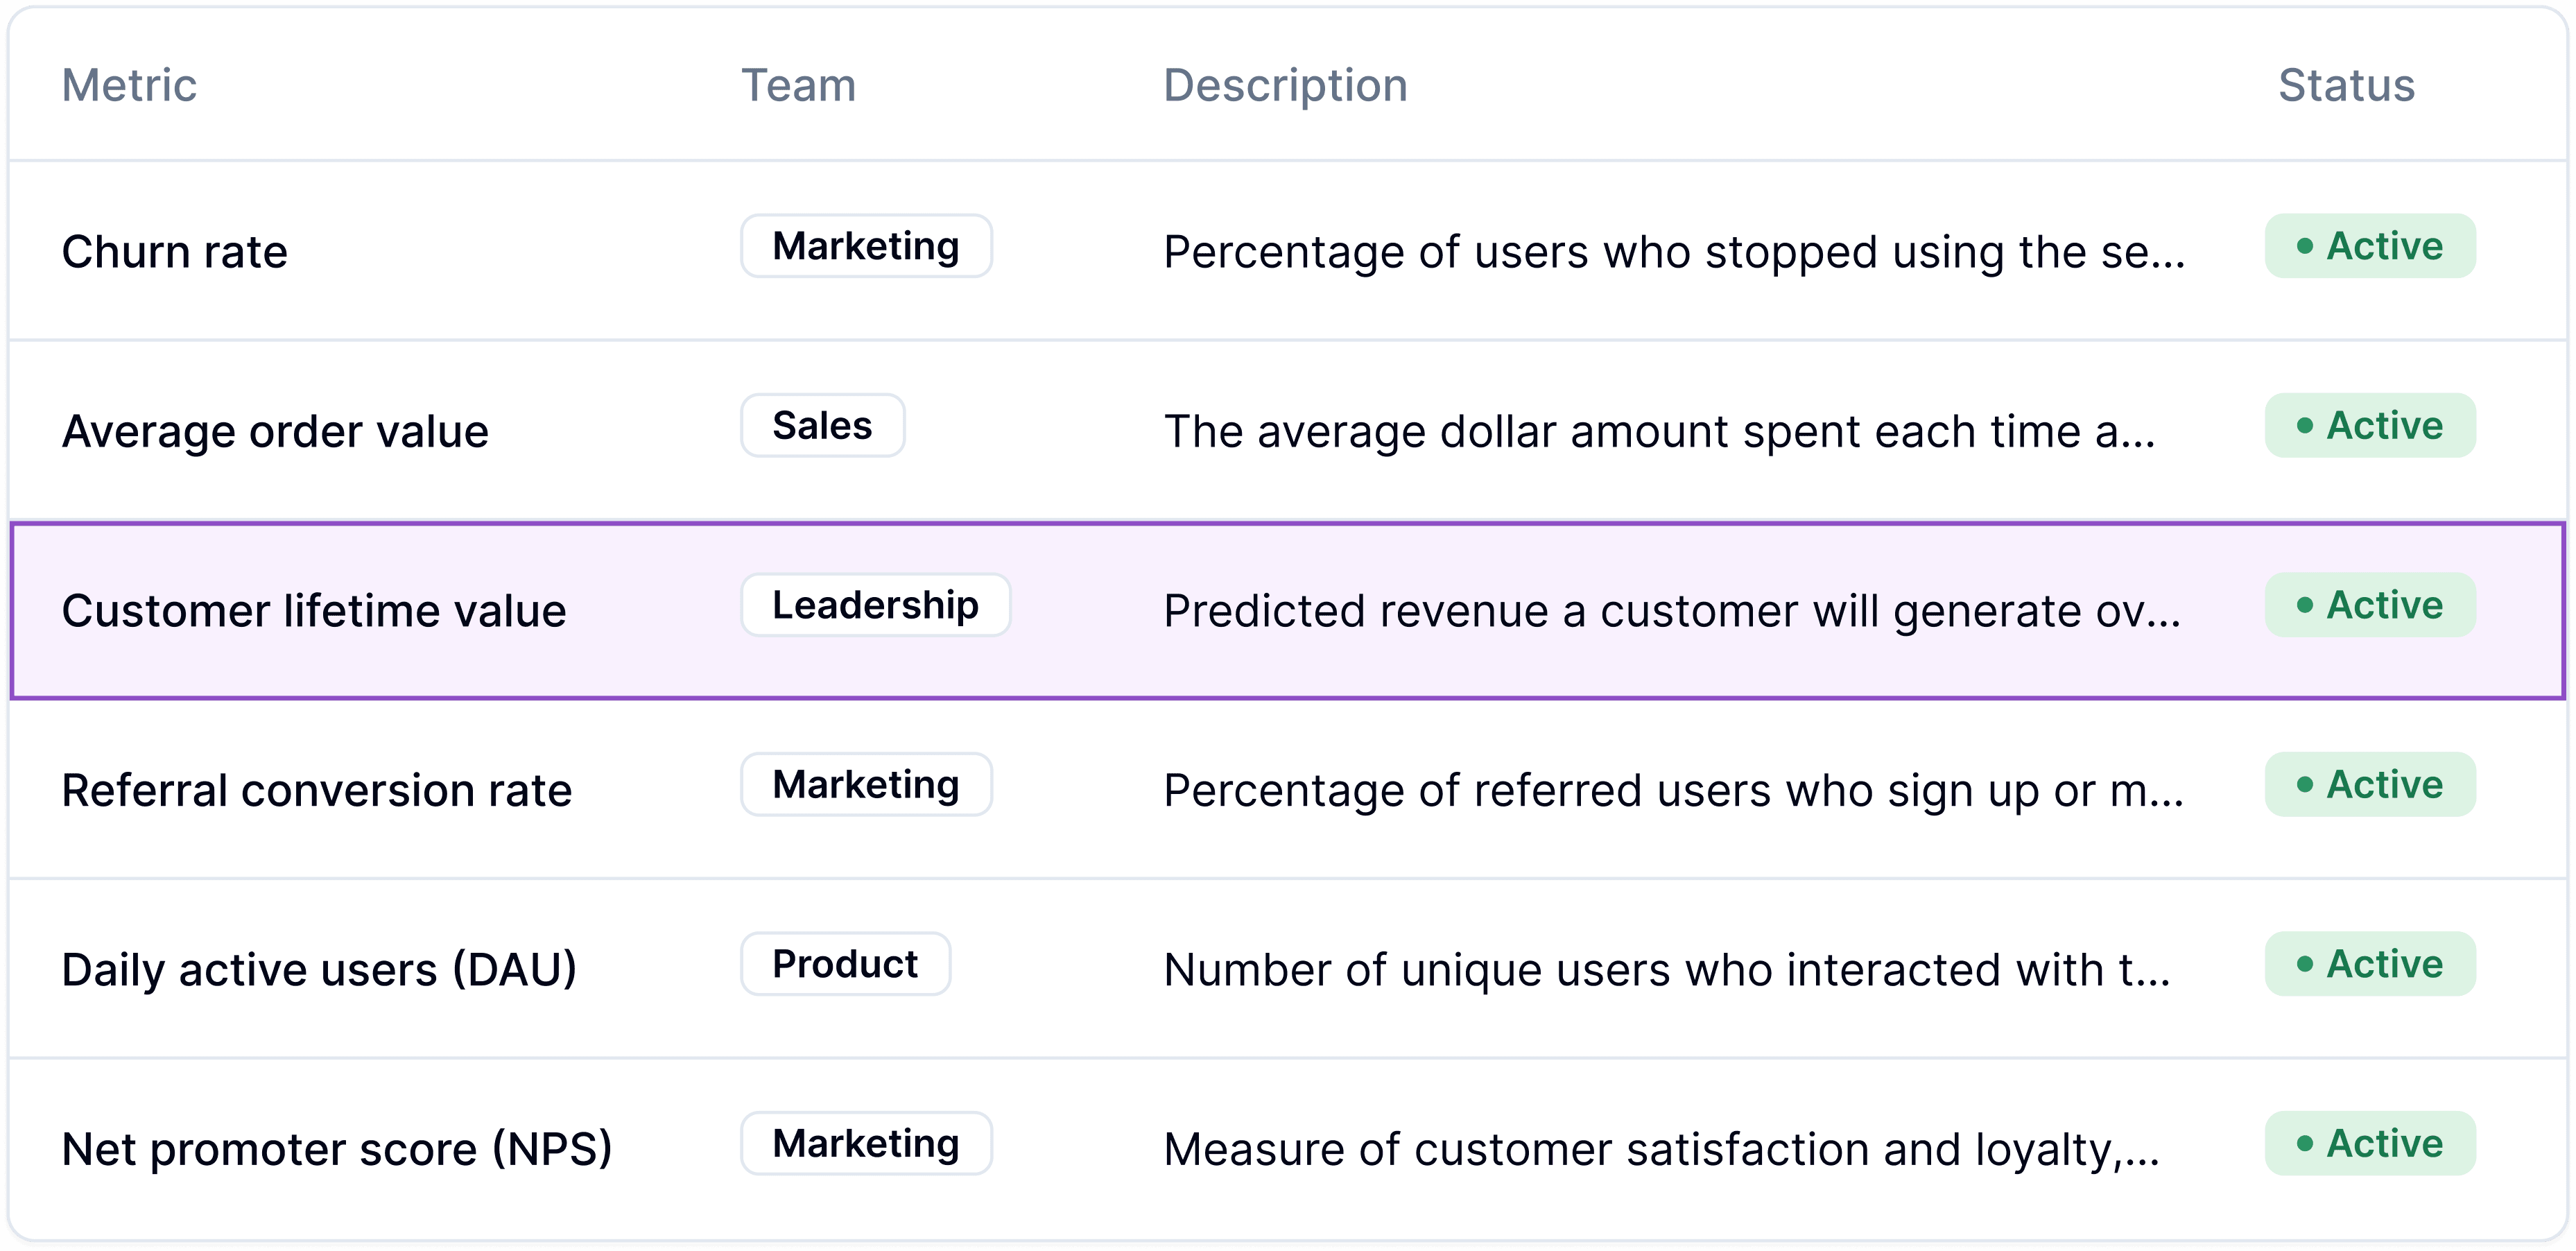
Establishing a defined semantic layer of valuable business metrics is the first step. Like onboarding a junior analyst with training programmes, these metrics help the LLM know where to look, how to calculate answers and critically, notice when it doesn’t know something.
An LLM now trained on metrics, and their associated dimensions and views, can recognise a variation of related queries immediately. More complex metrics can be introduced to the LLM once it's training on your ‘most-asked’ metrics.

The more accurate and precise your metrics are, the quicker the LLM can be given autonomy to converse with business users. It’s similar to a junior analyst knowing where to find an answer, rather than having to calculate each answer themselves.

Think in simple terms
Every business user thinks and communicates using concepts like revenue, churn, or average delivery times - not in code.
A data team can translate these frequently-used concepts into a metrics layer your LLM can digest. The metric layer allows for more abstract, accurate and understandable data querying than an LLM translating everything from natural language to raw SQL. Exact SQL queries are very specific directives - ideal for data professionals who know exactly what to ask, or are searching for an existing query, but difficult to leverage for anyone non-technical. If you want to enable self-serve insights, a metric layer is the way to achieve it.
Here’s a simple example of how an LLM uses a metrics layer to generate an answer for revenue month on month. In this case, it's using 'MQL' (Fluent's metrics querying language) to reach the answer. This focuses on three main components explained below:
Measure:
revenue.total- The measure represents a predefined calculation (likely the sum of revenue) that has been centralised within the MQL setup, and is stored as predefined SQL code.Dimension:
regionandorder_date.month- The dimension in a MQL query corresponds to the columns in the data table. Dimensions are used to segment or group the metric, breaking down the data into categories or time periods.View - The view isn't explicitly named in this query, but it would be the underlying data source that holds the revenue, region, and order_date information.
Unlike more verbose SQL queries, a metrics layer abstracts the complexity, and limits the LLM’s freedom to interpret queries, ultimately leading to better performance. Here’s a few more examples of commonly-asked queries constructed in MQL.
Customer Retention & Churn
"How many customers have churned since July?"
This query identifies customers who haven’t engaged in the last three months, which the business defines as churned. Training the LLM to recognise this metric allows it to autonomously respond to a number of churn-related questions.
Delivery Performance
“Whose our quickest delivery driver?”
This metric is showing the average delivery time for shipments, grouped by the carrier, then ranked in ascending order.
shipments.avg_delivery_time: This is the measure in the query, in this case, the calculation for the average delivery time for shipments.carrier: This dimension is the average delivery time is being grouped by the carrier, meaning you will see the average delivery time per carrier.shipments: This refers to the underlying view from which the data is being pulled. In SQL terms, this would be similar to a table or dataset that contains fields likeavg_delivery_timeandcarrier. As mentioned, in MQL, views are often not explicitly mentioned but are inferred from the metric definitions.
Turning natural ambiguity into scalable productivity
Business users will inevitably phrase their questions in different ways, so teaching the model to recognise synonyms - such as “revenue” being used interchangeably with “sales” or “income” - lets the LLM tackle multi-step questions, without needing a pre-written query for this exact scenario. If someone asks, "How much revenue was lost to customer churn in the last 6 months?”, a trained LLM should be able to generate a query combining both revenue and churn metrics.
The data team managing the LLM has an easier job of updating and editing existing metrics, gradually introducing new ones, and not trying to diagnose incorrect answers. Meanwhile, the LLM serves business users accurate, consistent results, or flags to the data team that it can’t.
TL; DR
A metrics layer serves as the fast-track training that an LLM needs to deliver the most impact in a business. Once trained on your metrics, your definitions and your data, the LLM operates as a self-service analytics tool that either provides answers based on predetermined logic or flags queries it can't resolve. No guessing, no misinterpretation.
Day-to-day, the reliability of a new AI tool helps build trust with the data team. Knowing when to respond or indicate it doesn’t have an answer is how an AI tool earns trust and lasting engagement from the wider business. By behaving consistently and predictably, an LLM reaches its peak performance - a trusted, conversational layer over your data warehouse.
Get in touch
Here if you need us.
Drop us a line, we'd love to chat.


